Weekend Project: Audio Spectrogram using FFTW3
I've really enjoyed throwing together data visualizations and cool realtime graphs lately. I think they're a lot of fun, and can help you understand the underlying data better. I think it's particularly appropriate for things like this - where it is directly correlated with something else you can observe, linked together with very low latency. I had tried to do this project, about 4 years ago now, and visualized the data with a displaced mesh. I don't think it turned out very good, and I had a couple of fundamental misunderstandings about data types being used by FFTW3 and the inputs and outputs involved in computing the FFTs. Some architectural issues also existed, which resulted in the displaced mesh flickering very badly every other frame. Not to mention that having a couple years experience in industry, where other people see my code, has drilled into me some practices that have massively improved my code readability - going back to try to parse that codebase was pretty rough.
A spectrogram is a plot of the frequency content of a signal, in this case audio, over time. You can see the correlation between the sounds that you hear, and the image - with the sounds' pitch increasing to the right hand side. Something I think is particularly interesting in this visualization with engine sounds, are all the harmonics involved. You can see how there are parallel lines which show these integer multiples of frequency, and how they slope upwards as the engine RPM increases.
Getting this frequency information involves taking an FFT of a time domain signal. This is a Fast Fourier Transform, which is a class of algorithms which quickly compute a discrete-time Fourier transform on time domain data. The output of this transform is a set of complex numbers which contain information about the magnitude and relative phase of various frequency components of the input signal. Typically, for applications like this, only the magnitude of these complex numbers is important. That's what's being displayed in the little bar graph below the time domain signal display, with frequency increasing from left to right. Those same intensity values are also written to the image containing the spectrogram, once per frame.
This was also a good opportunity to learn about some of the audio utilities provided by SDL2 - I found this reference for audio streams, which came in handy for getting 800 samples per frame. By using a sample rate of 48000Hz, and displaying at a rate of 60fps, an FFT of size 800 made sense to use here. This is so that we can show unique data corresponding to the sound that is played during each frame. The SDL2 audio streams provide a queue-like interface, where you can load the data from a WAV file at startup and pop off 800 samples each frame to use as the real, time-domain input signal to the FFTW3 plan.
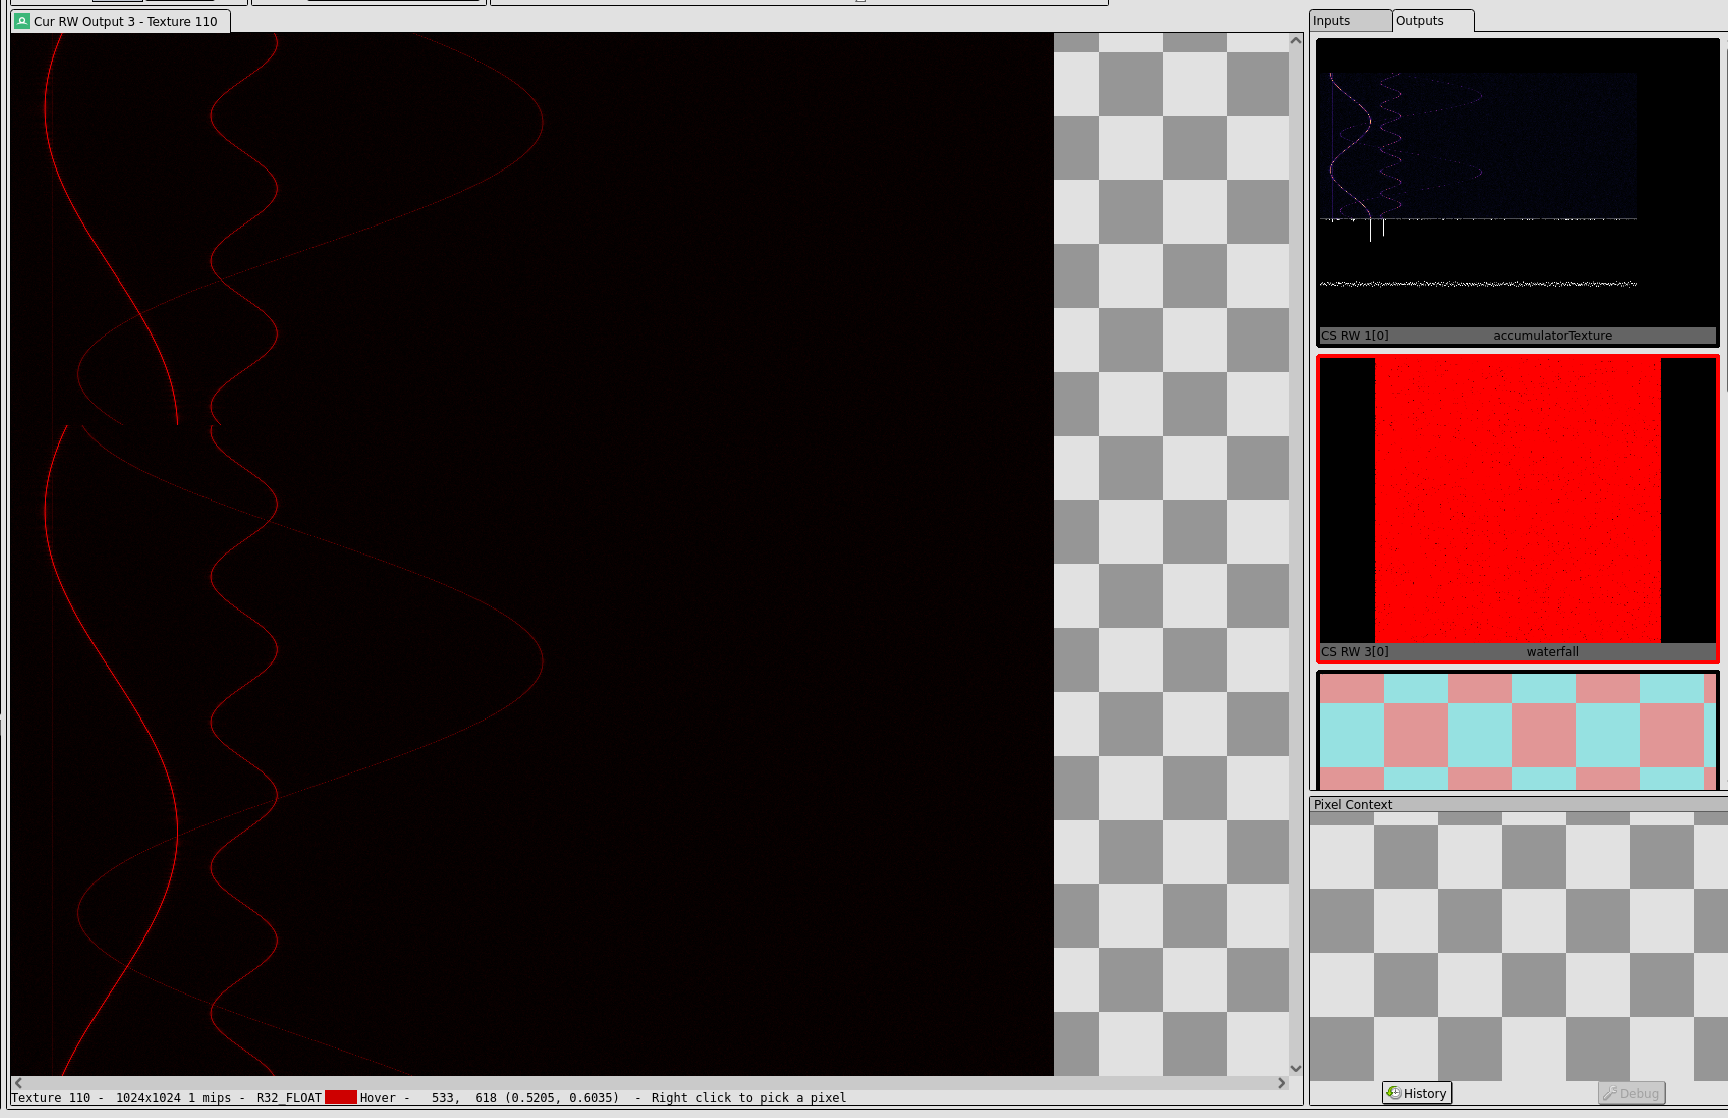
A cool implementation detail was the use a ringbuffer-style update of the texture data. Something I had intended to implement in another project with a friend last year, to visualize similar data, realtime brain activity data from an EEG headset. Using this approach, I was able to only update one row of pixels in the spectrogram image per frame, and keep CPU to GPU bandwidth usage very, very low. The whole process from end to end takes less than a millisecond per frame, even with the FFT being calculated on the CPU. You can see the frequency domain data for some sinusoidally varying test tones in the RenderDoc capture here, where the discontinuity is in this ringbuffer. By passing a Y-offset to the shader, I was able to compensate for this offset and loop around to the other side, to make the spectrogram seamless and continuous. It didn't do any fancy 3D visualization this time, but I think I like this version quite a bit better.