Dithered Raymarching Part 4: RGB Parade Graphs
I took a color training course here recently that dealt with a lot of information related to HDR pipelines, and among other things it touched on the usage of the Davinci Resolve video editing and color grading software. One of the tools provided by this software, for looking at the data content of images and videos is what's called an RGB parade - this is a type of graph that visualizes the distribution of the values in each color channel in each column of an image.
I prototyped this in a weekend, because I was curious to see what it looked like when you looked at the dithered output from the dithered raymarching project, which reduces the precision of the color in the image by various means (see earlier entries in this series of articles if you're curious). It still needs some work, specifically to scale the y axis logarithmically, instead of linearly like this implementation is currently doing.
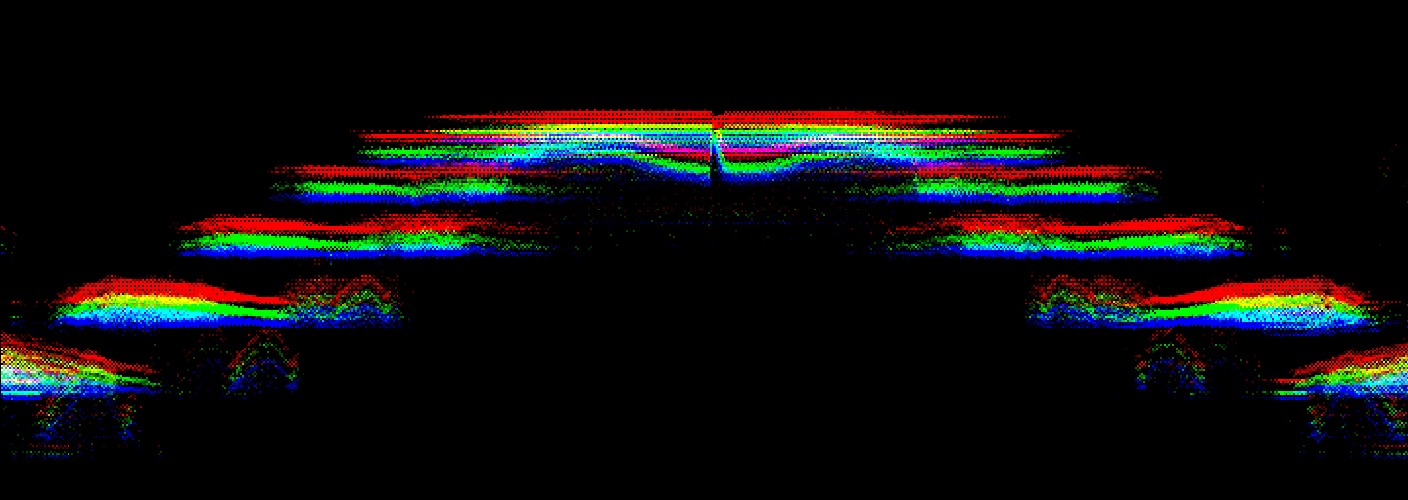
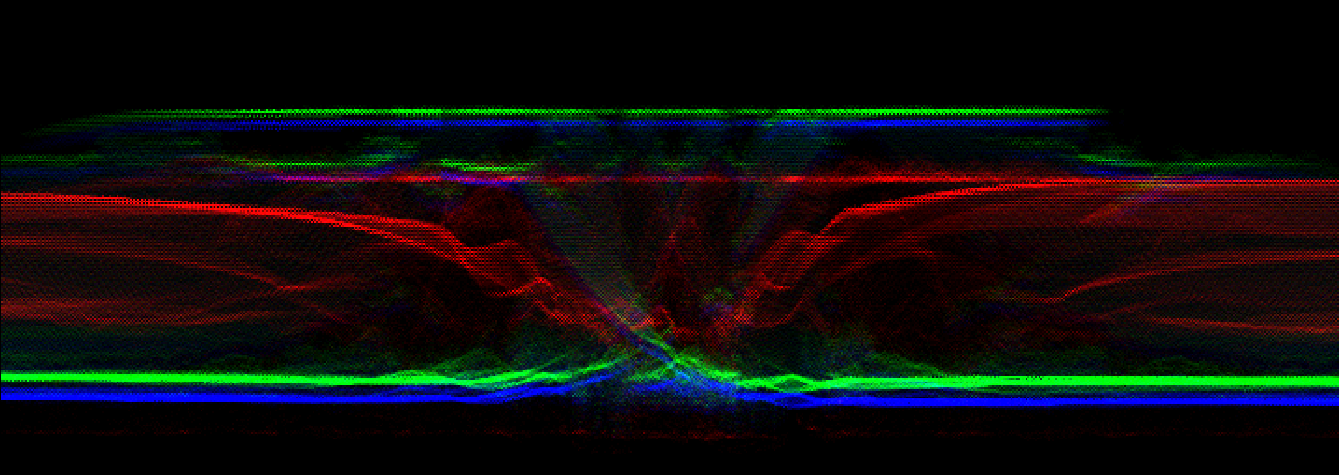
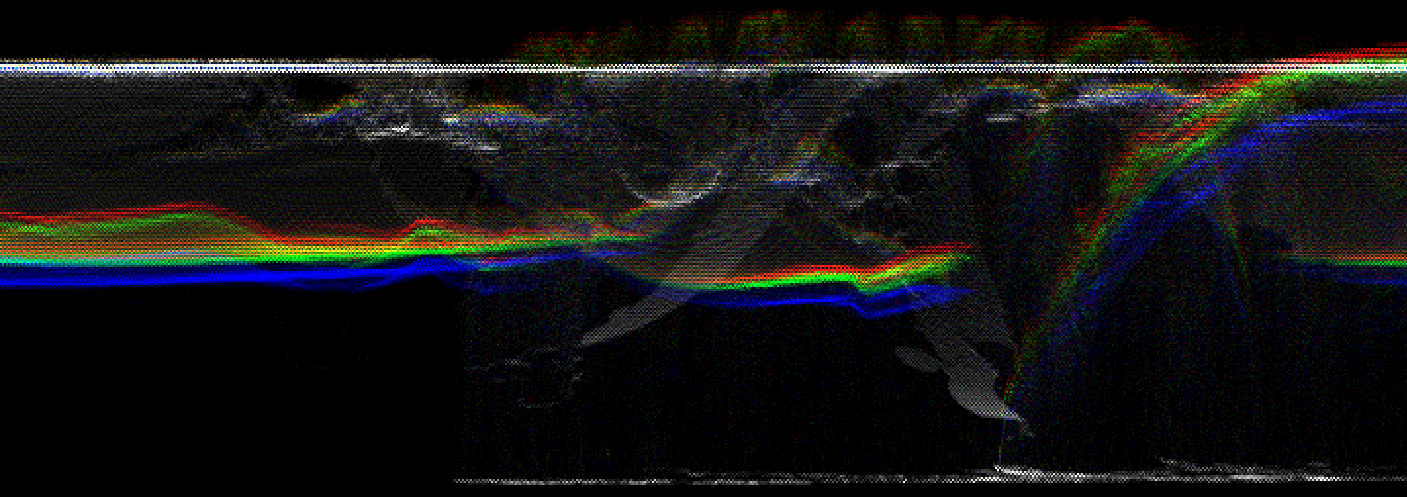
The graph is a histogram of color intensity, per column of the image. The x on the graph is the image x, the y on each colum indicates the intensity, in the range 0-255, and the brightness of each pixel in the graph indicates how many pixels in that column had that level of intensity. Above, you can see some example plots, for different images - these were taken as screenshots while prototyping in RenderDoc, so there is not an exact 1:1 mapping of pixels - if you look closely you will see some aliasing.
Implementation
This is implemented as two compute shaders, and four image buffers - three single channel uint buffers for atomic writes for each of the three color channels, and one RGBA8 buffer that can be used to present the graph over the output.
The first compute shader is the accumulator, doing atomic writes to construct the histograms. It takes from the existing framebuffer, after tonemapping and dithering have been applied, with a dispatch large enough to cover every pixel in the image. The .x of the gl_globalInvocationId is used to determine which column that this shader invocation will be incrementing, and the y value is determined by the read intensity of the value in the framebuffer for each color channel.
Once all the invocations in this first dispatch have completed, tallying the occurrences of that intensity in that column of the image, the second compute shader is invoked. This shader takes these three image buffers that received the atomic increments from the previous shader, and maps them to usable ranges in the 8-bit R, G, and B channels, to indicate how many occurrences there were. The alpha channel takes the max of these three values, so that we only have data displayed where it exists.
This video gives a quick demo and overview of the process taking place, showing off the realtime overlay: