Line Renderer
I've recently had call for a good line renderer, in a couple of different places. I've implemented a system here that handles both opaque lines and a limited form of order-independent transparency using a series of compute shaders.
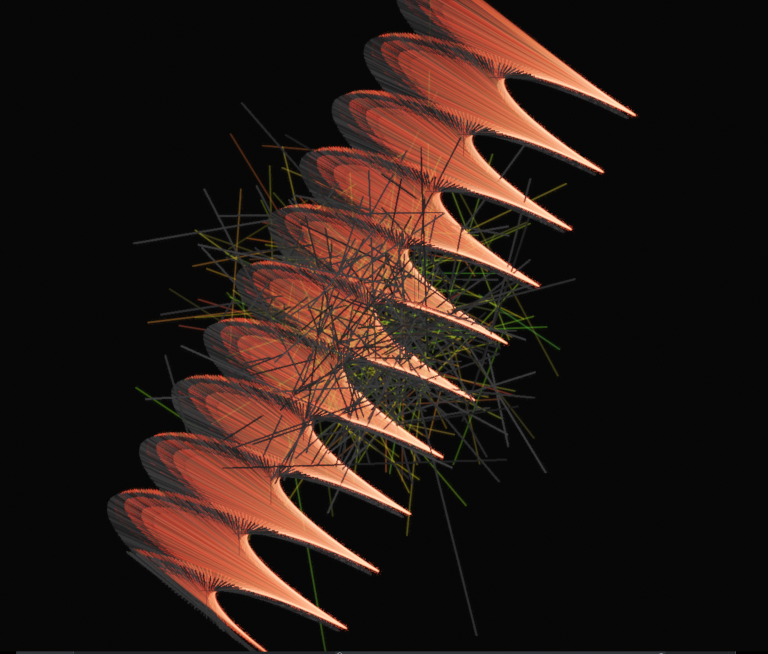
The line drawing itself comes from Alois Zingl, whose thesis generalized the Bresenham algoritm to many different drawing routines. He's got it doing bezier curves, circles and ovals, and basically arbitrary function plotting. The one that I was most interested in was the wide antialiased lines at the bottom of that page. I was able to use the AA term for the transparency, but was not able to for the opaque.
Architecture
There are three passes and then a sort of deferred composite pass. The lines are split into two groups: opaque and transparent. Opaque lines will first do a depth pre-pass, writing interpolated depth between the line's endpoints.
This depth data is then used in two different places. The first is for a depth-equals pass that writes uint line IDs (+1, keeping 0 as a reserve value for "empty") to another buffer if it produced the same texel depth. The second place is the transparent line drawing, which uses this depth buffer for occlusion of transparent lines. When drawing transparent lines, atomic writes are made to buffers representing a sample count (which is weighted by an antialiasing factor on the line edges) and a color total. Together, these values allow for later averaging.
Once these three passes have completed, the deferred composite pass runs. For each texel, it's looking at potential contributions from opaque and transparent line drawing. First, an ID value is loaded from the output of the opaque process (subtracting 1 to get the correct index back), and a color is fetched from an SSBO holding the line data. Second, the total and weighted sample counts are used to compute the OIT result. I say it is a limited form of OIT, it's really an average of all succeding transparent writes and does not do faithful blending. I compute an alpha term from the sample count, similar to Beer's law, and use that to compute the alpha blended result of the transparent over the opaque.
Future Directions
I have a couple applications for this in mind. The biggest one is a ray debugger, but I also want to do something to visualize edges and neuron activations in a neural network. I'm particularly fascinated by this graph visualization project called Walrus by CAIDA. I think I've found a shadertoy example that will help replicating the hyberbolic transform that they are using. I'll be writing more about those applications as I make progress on them.