Weekend Project: Daedalus Color Grading Tools
I've been getting a bit more GPGPU experience at work. Learning more about atomic operations and how they can be useful, and got the idea to circle back to this. I have written an RGB parade graph/waveform display before, but it used manual scaling of the total values, rather than having a proper normalization factor when preparing the output. You need to know the maximum value in your histogram, in order to get a proper accounting.
Without this, it has the potential to clip, and doesn't look super good. Probably suitable for my degree of usage, but there was a problem I solved elsewhere, where I kept a field-wise maximum by updating a single float SSBO with atomicMax, every time I did an atomicAdd. I did something very similar here, and then I have that max uint value available, to divide all the values and get them into the normalized range, 0..1.
I did something similar with an overall channel brightness and luminance values, something that looked very much like the luminance histogram that is shown on a lot of dedicated camera UI, so that you can see if your exposure is set correctly. There, you lose data, if your values clip on the top end of the range - it's unrecoverable. You have to be able to judge in realtime, during the capture, or else that information is not captured.
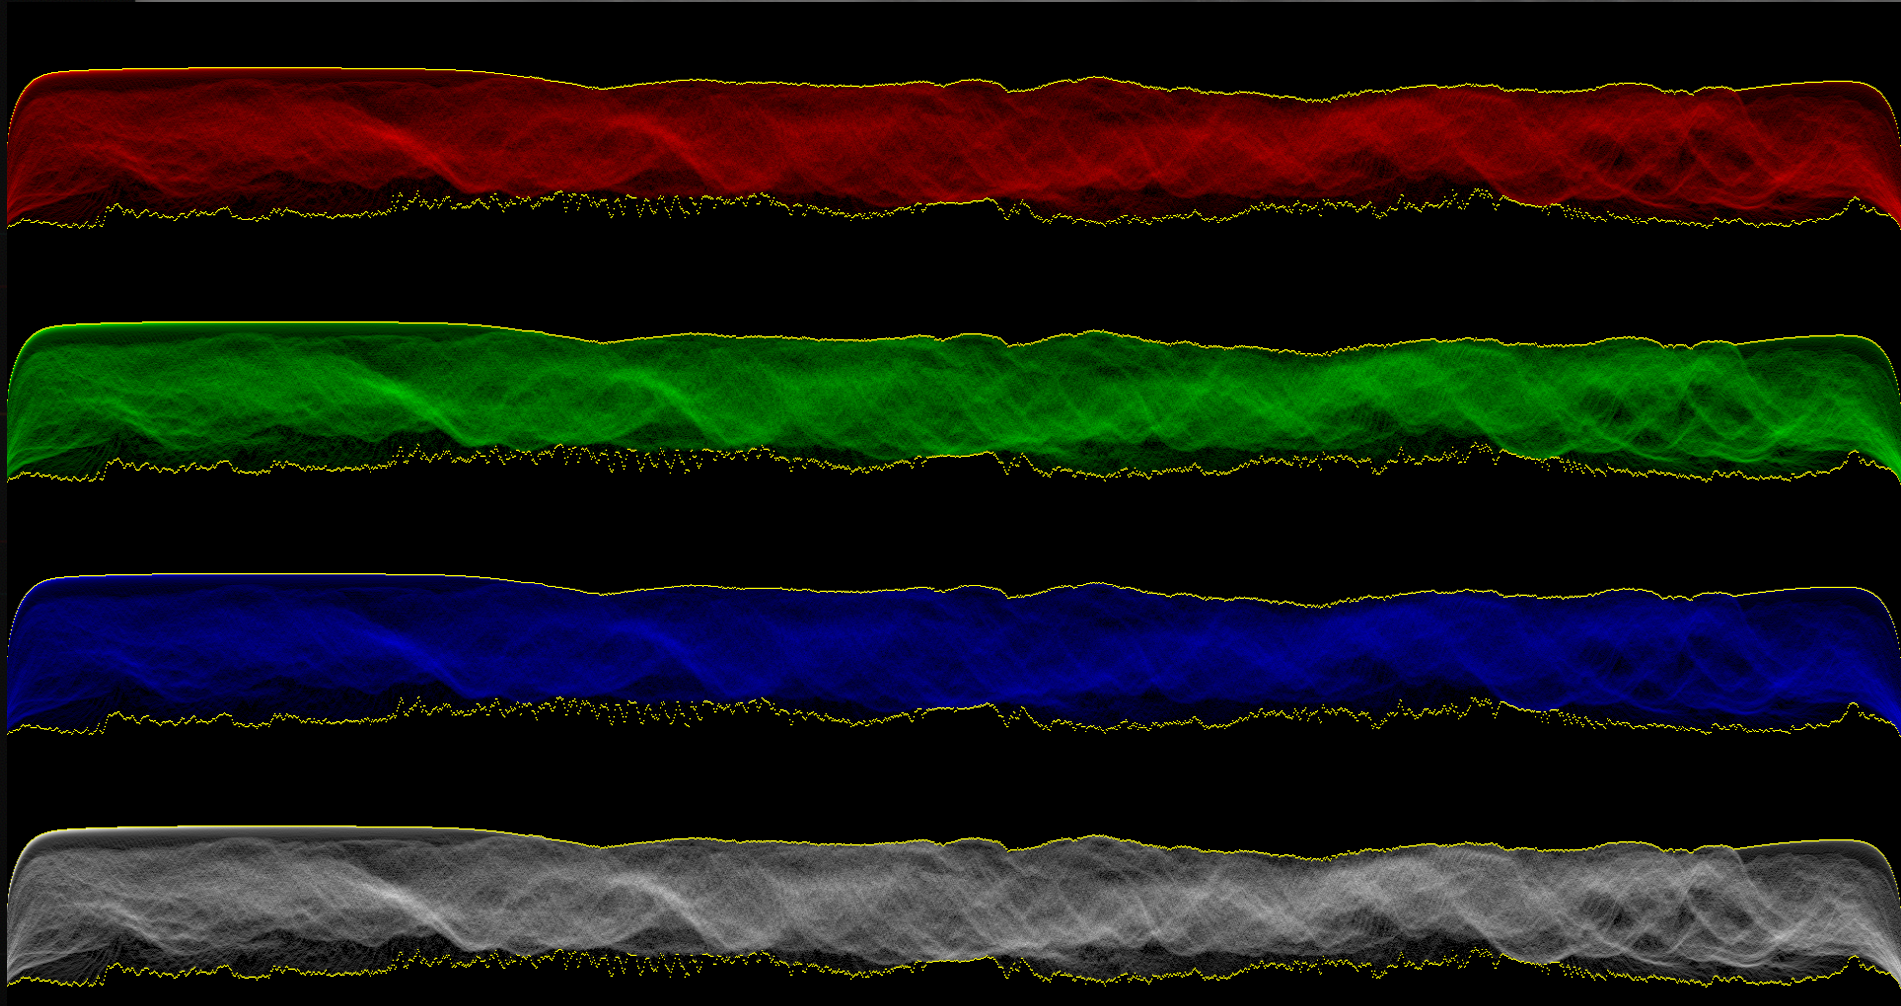
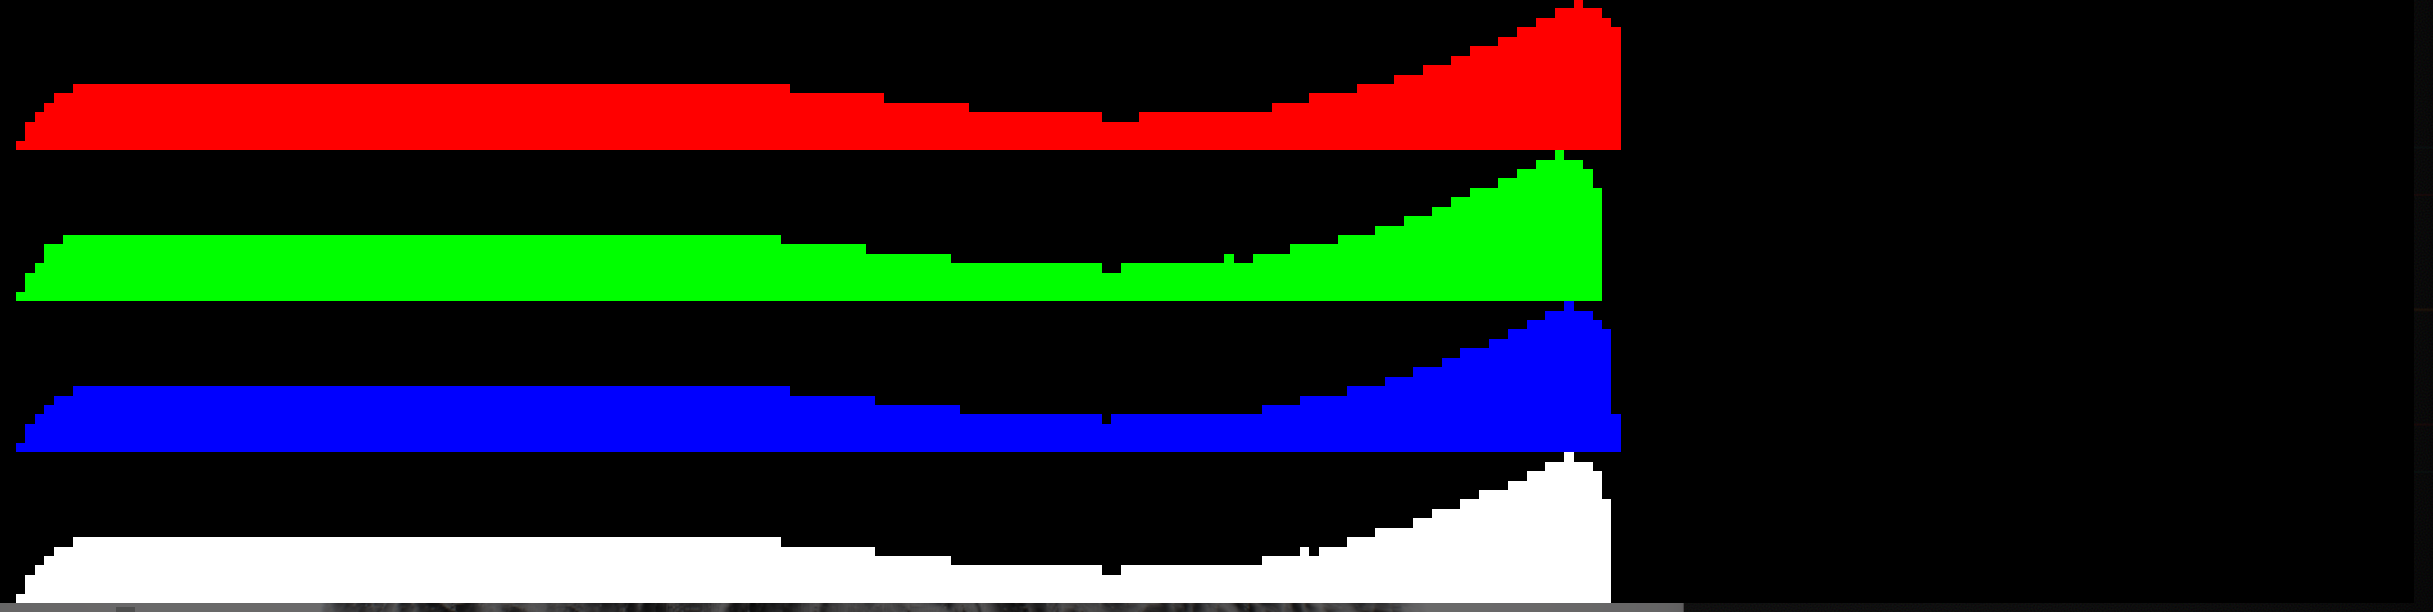
This luminance/channel brightness histogram is the same as the waveform display, but with all columns mashed down into one, and the Y axis made sideways so that it becomes the X axis. Hopefully that helps contextualize - the waveform display is an independent one of these histograms, for each column of pixels, displayed as brightness, vertically. Having the spatial correlation on image X helps colorists quickly judge where an image may be clipping or have other issues, and adjust the distribution of values as they see fit. It also has applications in maximizing usage of dynamic range on output file formats, if that's a priority. It looks pretty cool, in motion.
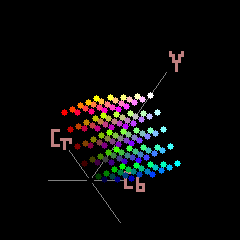
I think this looks really interesting, like a heightmap display - especially when rotating the viewer on the roll axis. I want to mess with this more, I have heard that some IFS renderers actually work in a very similar way.
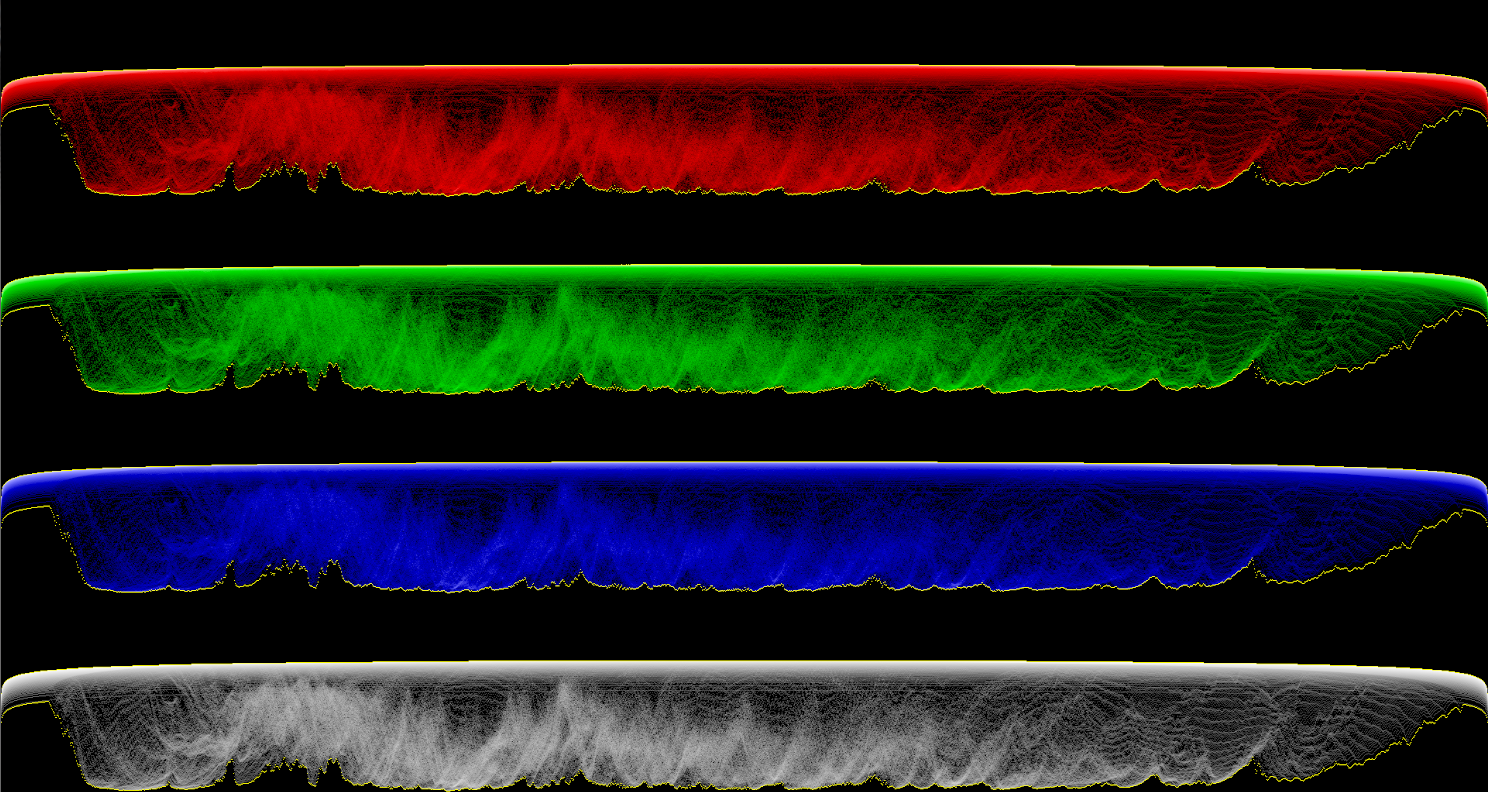
I tried using a path-to-white tonemapper, and had limited success with that. I saw some implementations of these, where they showed the individual color channels like I am doing, and tried to get more dynamic range out of it by having it represent histogram values with a gradient that went, for example, black to red, to white towards the maximum. I think this is more expressive than what I had been trying, so I may circle back to this to play with it more eventually. Was not able to get the tonemapping curve to be what I wanted it to be for all channels at once, so it probably makes sense to do this with a different curve for each red, green, blue waveform. There is also another commonly used version of this, where red, green, and blue are stacked up and displayed on the same axes.
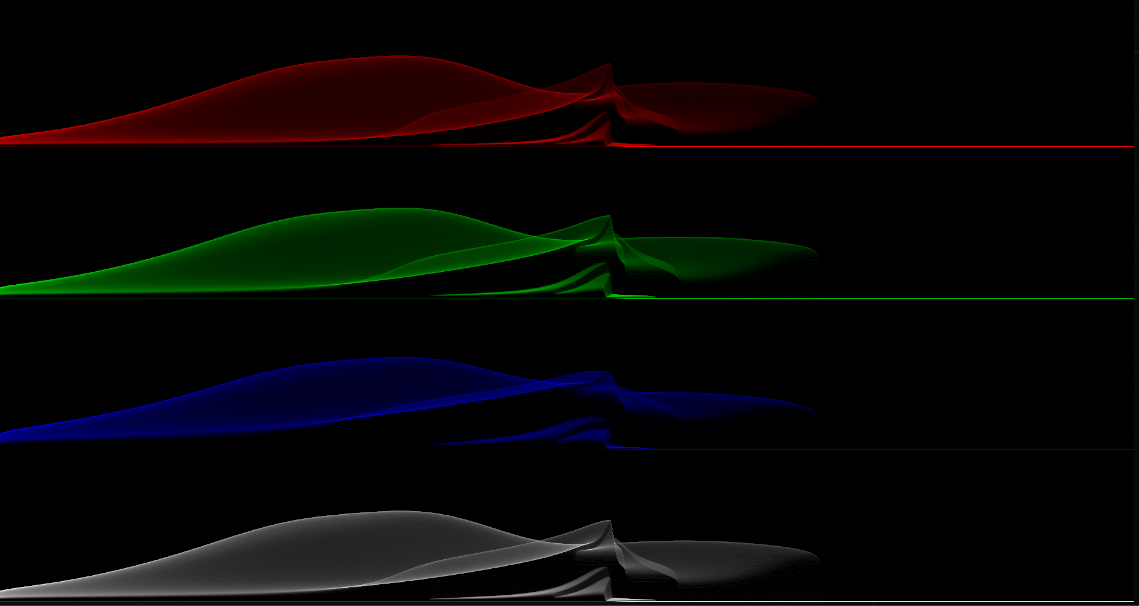
The last thing I messed with is what's called a vectorscope. This is a pretty unique tool, and again, it's for colorists - to solve a specific issue called color constancy. When color grading footage for long periods of time, it's easy to have your eyes compensate for a particular config, and you lose your objective standard. Things like reference white bias lighting are used, too, but this is something where you can quantify hue with the angle, and something like “saturation” or “chrominance” is where the points get plotted along the radius on the graph. I messed with plotting these points in a couple of different color spaces - YUV spaces keep luma in the Y channel, and the 2d chrominance in the UV. I used YCbCr, and plotted the points on this using imageAtomicAdd. Same scheme for maintaining the max via atomicMax on write.
Because this plotting strips off the luma data, and YUV spaces are oddly shaped, it's very easy to go out of gamut if you do some kind of trivial recovery here, like using the normalized count as the Y value. That's also not really representative of your color data. I ended up finding a shadertoy post that had a gamut clamp for YCbCr, and using that. I set the Y value to a constant 0.5 and increased the saturation of the transformed color. It can't represent hard red, the way I'm using it, but I think that's a tolerable limitation. This is a somewhat interpretive take on a color vectorscope.
You can see some of that clipping behavior here, before I had added that clamp. Colors just kind of dissappear and it doesn't really have much correlation with what's happening with the image, so it just kind of sucks.